Booking page funnel report
What this covers
Whether your public booking page is turning visitors into bookings, and where it loses them.
Requires the view-reports permission and the Public Booking Page feature —
note this report does not need the advanced analytics feature. It is the fifth tab under
Reports.
The funnel
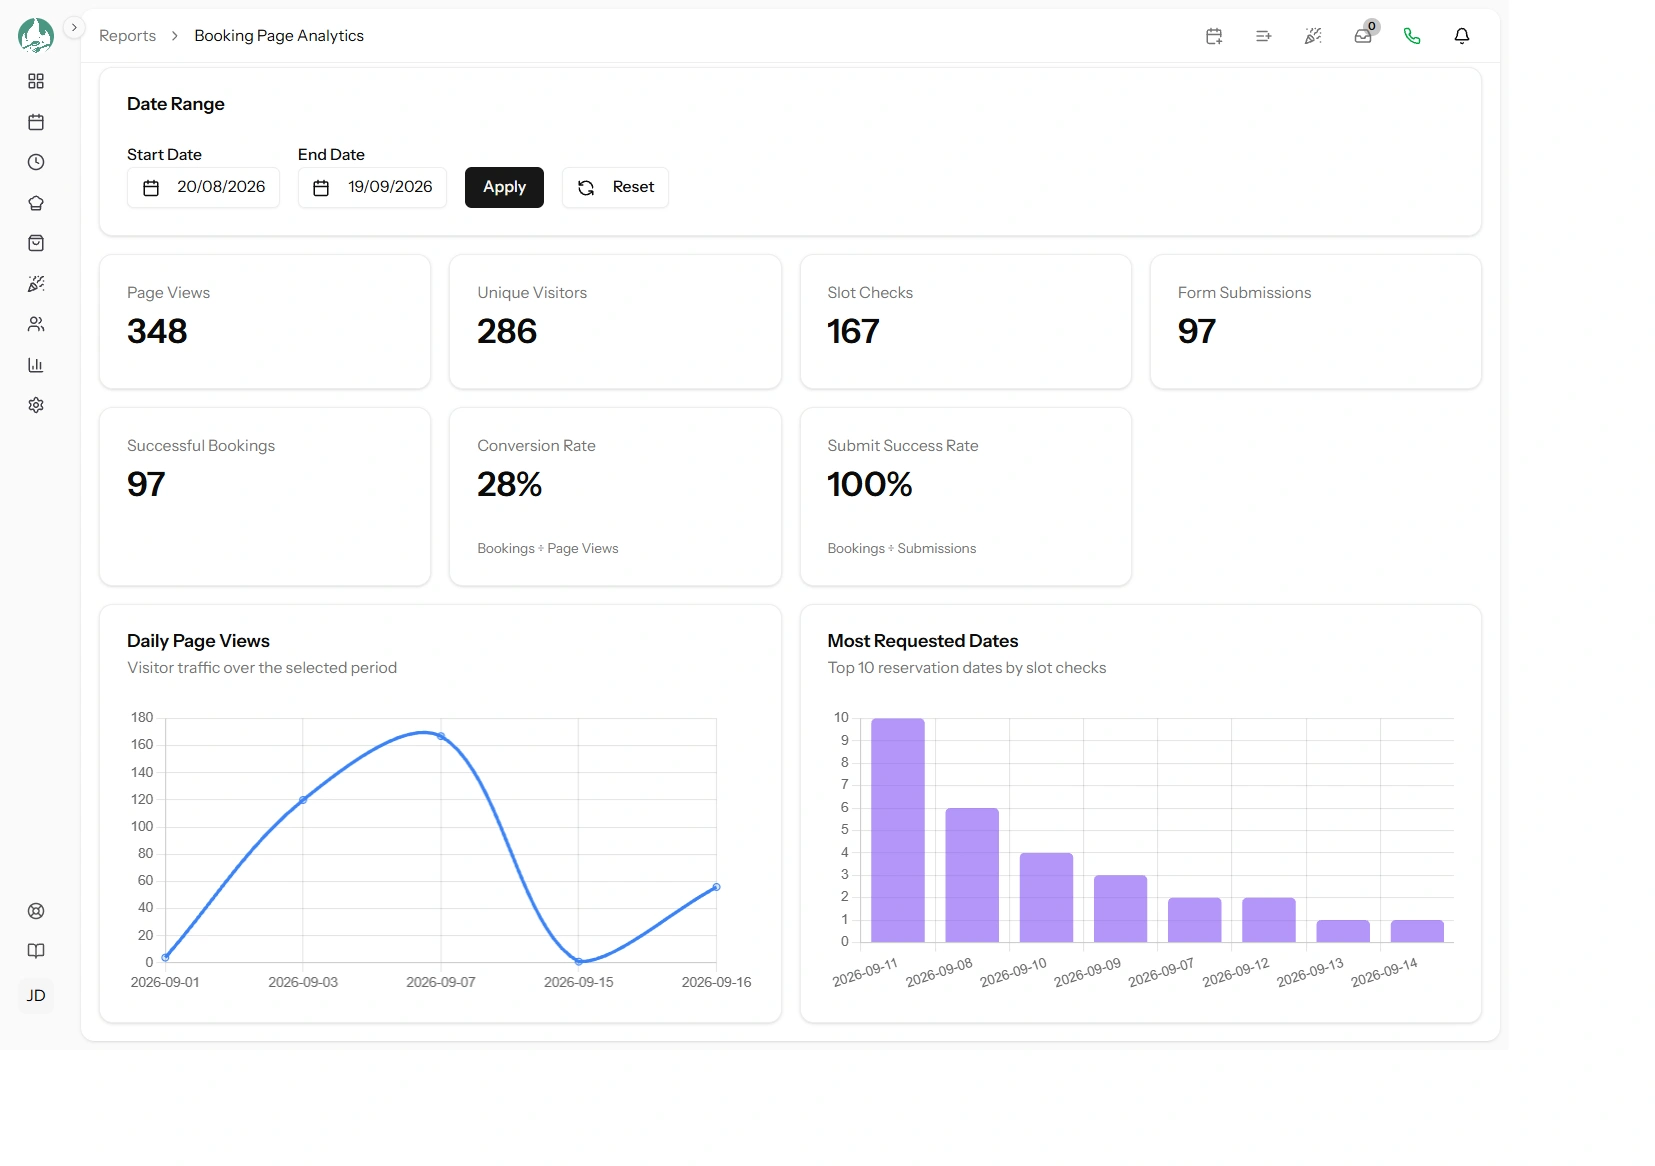
Four steps, in order. Each is a smaller number than the one before, and the drop between any two is where your attention belongs.
| Step | Counted when |
|---|---|
| Page views | Someone opens your booking page |
| Slot checks | Someone picks a party size and date, and asks what times are free |
| Submissions | Someone fills the form and presses book |
| Successes | The booking was actually created |
Plus two rates and a visitor count:
- Conversion rate — successes ÷ page views. Your headline number.
- Submission success rate — successes ÷ submissions. How often someone who tried, succeeded.
- Unique visitors — an approximate count of separate people who viewed the page.
Reading the drops
Each gap has a different cause and a different fix. This is the diagnostic value of the report.
Views are high, slot checks are low
People arrive and do not even ask for times. They are bouncing before they engage, so the problem is the page itself or the traffic reaching it:
- Does the page look like your restaurant? Unbranded pages get abandoned (link Branding your public pages).
- Is your intro text doing any work, or is it empty?
- Are your party-size limits too narrow? Someone booking for two who sees a minimum of four leaves.
- Where is the traffic from? A link on a listing site brings browsers, not bookers.
Slot checks are high, submissions are low
People ask for times and do not proceed — which usually means they did not like the answer. Either no times were offered, or none that suited.
This is the most common shape, and the most commonly misread: it looks like a page problem and it is almost always an availability problem. Check your advance notice, your pacing, your operating hours and your durations against Why a time or table isn't offered.
Submissions are high, successes are low
People completed the form and the booking failed. A low submission success rate is the most urgent thing this report can show you, because these are guests who genuinely tried to give you money.
Usual causes: the slot was taken between their choosing it and submitting (two people racing for the last table), or the request fell foul of a rule the page could not show them earlier. A persistently low rate means a rule is fighting your guests.
Everything is proportional and small
Then the funnel is working and you need more traffic, not a different page. That is a marketing question — and worth checking your search visibility (link SEO and analytics for your booking page).
The two charts
Daily views
Page views per day. Use it to see the effect of something you did, and to learn your own rhythm — most restaurants have a weekly pattern in when people plan.
Most-requested dates
The ten dates guests asked about most. This is the most actionable chart in the product, and it is worth understanding exactly what it is.
It counts what guests asked for, whether or not you could offer it. So unlike every other report — which can only tell you about bookings you took — this one shows you demand you may have turned away.
Note also that these are the dates requested, not the dates the asking happened, so the chart will name dates in the future. That is the point: it is a forward demand signal, weeks before your diary shows it.
How to use it
Take the top dates and compare each against your actual diary for that date:
- Heavily requested and you were full — that is turned-away trade, and the number tells you how much. Options: open another sitting, extend hours for that date, add a seating, or put a table back that you had removed.
- Heavily requested and you had space — people wanted that date and did not book. Go back up to the drop analysis: something between asking and booking stopped them.
- A date you did not expect — a local event, a holiday, a school term change. Worth knowing before it arrives.
A restaurant that reads this chart weekly and opens capacity on its top requested dates is doing the single highest-return thing available in this whole section.
What is measured, and what is not
This is measured anonymously. No names, no email addresses, no IP addresses and no browsing history are stored. What is recorded per event is: which of the four steps it was, the party size and date asked about, when it happened, and two irreversible fingerprints used to tell one visitor from another without identifying either.
Two consequences:
- You cannot see who viewed your page, or contact them. There is nothing to contact.
- Unique visitors is an approximation. A couple looking together on one connection may count as one person; the same person on a phone and then a laptop counts as two. Read it as a scale indicator, not a headcount.
Good to know
Only the public booking page is measured. Bookings your staff take, and bookings from the chatbot, are not in this funnel — so successes here will be lower than your total bookings, correctly (link What your guests see).
Analytics never blocks a booking. If recording an event fails, the booking still goes through — measurement is never allowed to get in the way.
There is no export on this report.
It is separate from Google Analytics. If you have connected your own analytics, that measures visits; this measures the funnel end to end, including the part Google cannot see (link SEO and analytics for your booking page).