Utilisation report
What this covers
Whether you are using your room well: how much of your open time your tables are booked for, which
tables are working and which are not. Requires the view-reports permission and the
Advanced analytics & reports feature.
What "utilisation" is measured against here
Worth understanding before the numbers, because it decides what you can conclude.
This report works from booked time: each booking's start time and its duration, measured against your operating hours. It does not use the times your staff pressed arrived, seated or completed.
So it tells you how much of your room you have sold, not how long guests actually sat. That is the more useful measure for pacing and capacity decisions — and it means the setting that most affects this page is your default duration, not your staff's timekeeping (link Booking rules reference).
Status still matters in one way: cancelled and no-show bookings are excluded, everything else counts. So a no-show left sitting as confirmed is counted as time the table was working, and inflates every figure here. That is the argument for status hygiene on this page (link Automatic no-shows and completion).
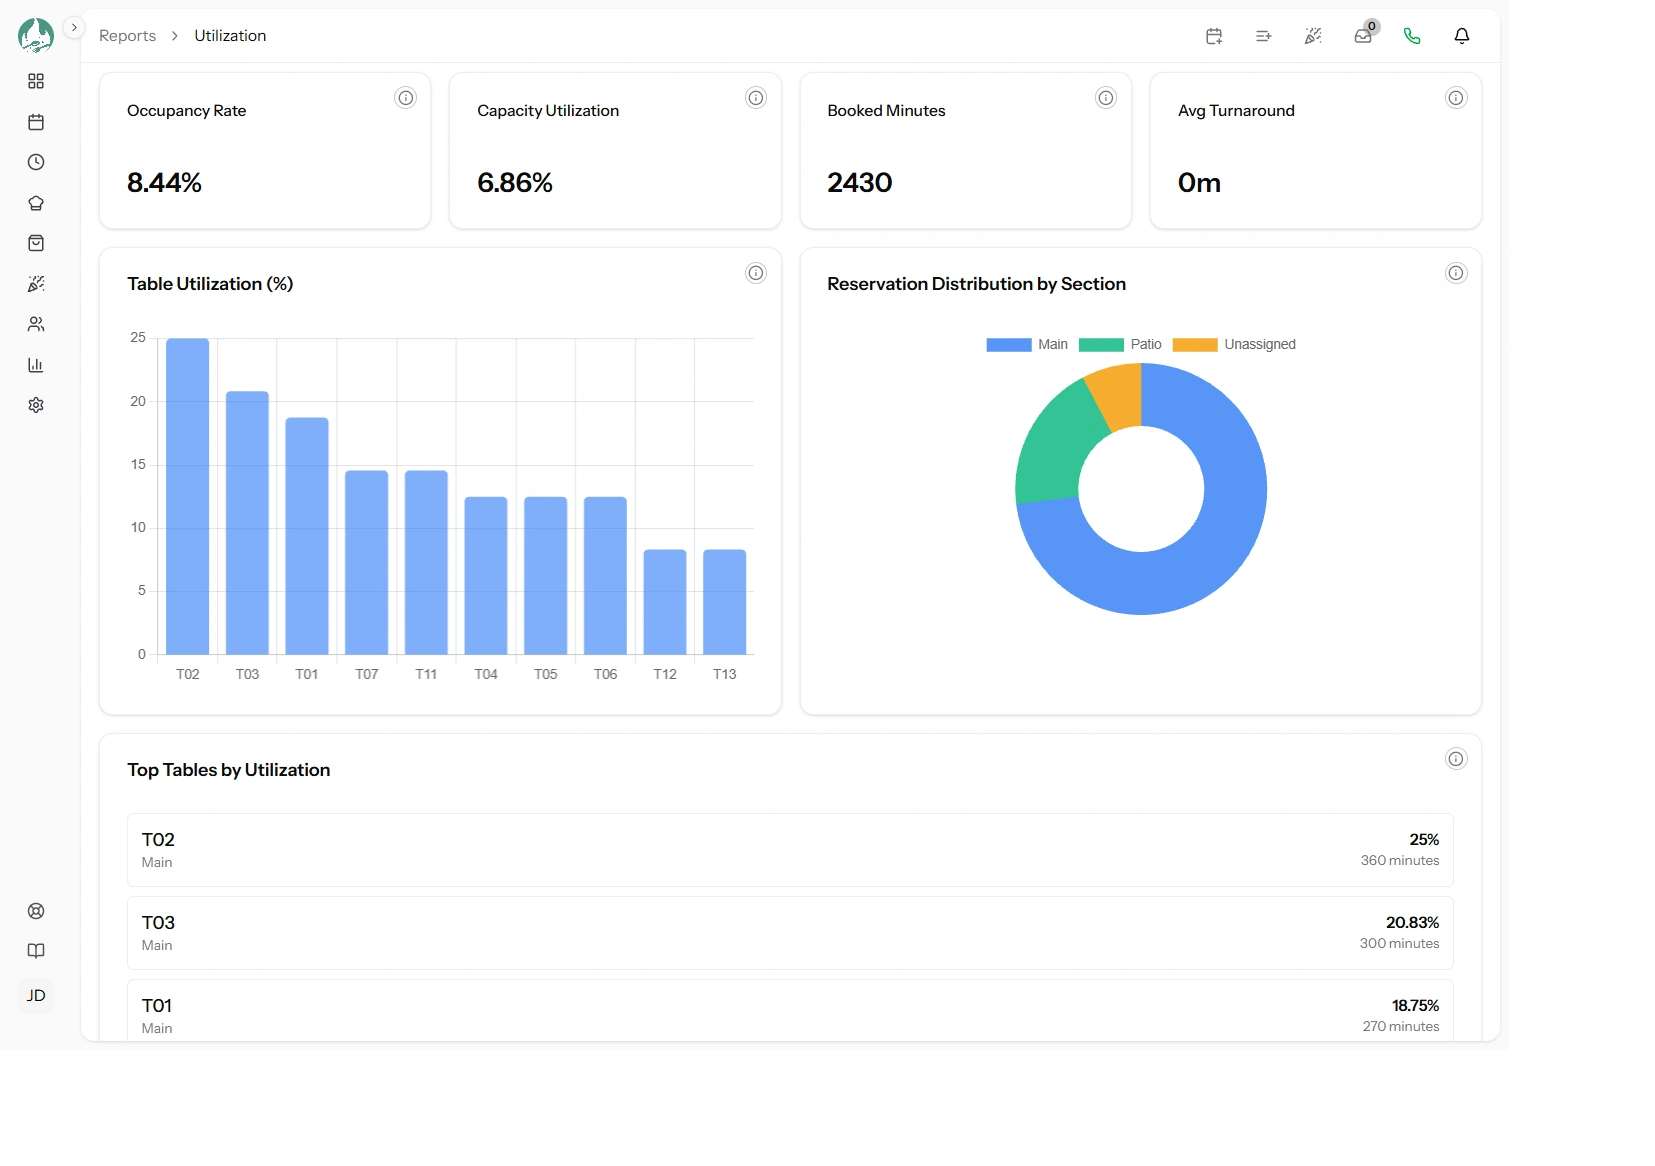
The numbers at the top
| Card | What it means |
|---|---|
| Active tables | How many tables were counted — inactive tables are excluded from everything here |
| Occupancy rate | Booked table-time ÷ all the table-time you had available. "Was the table in use?" |
| Capacity utilisation | Booked seat-time ÷ all the seat-time you had available. "Were the seats in use?" |
| Average turnaround | The average gap between one booking ending and the next starting on the same table, on the same day |
Occupancy versus capacity — the gap is the point
These two look similar and answering the difference is the most valuable thing this report does.
Occupancy asks whether the table was busy. Capacity asks whether the seats were. Seat a couple at a table for four and the table is fully occupied while half its seats earn nothing.
So a high occupancy with a much lower capacity utilisation is the classic finding: your room is full and your seats are not. You are turning bookings away while carrying empty chairs. The fix is table shapes and assignment, not more demand — smaller tables, or combining rather than seating pairs at fours (link Merging tables).
Both moving together means your table sizes suit your parties, and growth needs more bookings rather than a rearrangement.
Reading the percentages honestly
Do not expect numbers near 100%. Occupancy is measured against every open minute, including the quiet ones — a restaurant open 12:00–23:00 whose trade is two dinner sittings cannot be more than about half occupied, and is doing fine.
The absolute figure matters far less than its direction over time and how it compares between your own tables. Note it monthly and watch the trend.
Two useful consequences of the denominator being your operating hours: closing a day you never traded improves your figures, because closed days contribute nothing; and extending your hours will lower them, which is arithmetic rather than a decline (link Operating hours).
Average turnaround
This is the scheduled gap between consecutive bookings on a table — the slack in your plan, not how fast your staff actually clear. A low number means you are booking tables back to back and a late-running table will cascade; a high number means comfortable resets and capacity left on the floor.
If it is smaller than the time your team genuinely needs to turn a table, your pacing is the reason service feels frantic (link Booking rules reference).
The charts
Table utilisation ranking
Your ten busiest tables by the share of open time they were booked for. Read it from the bottom.
A table far below the rest is telling you something specific — it is awkwardly placed, next to the kitchen door, the wrong size for your typical party, or simply never suggested because something else always fits first. Any of those is fixable, and an unused table is floor space you are paying rent on.
Section distribution
How your bookings split across sections, counted as bookings rather than time. It includes an Unassigned slice, and that slice is worth watching: a large one means many bookings never got a table, which both hides real occupancy and is a service risk (link Unassigned reservations).
Decisions to take from this report
- Adjust your default duration. If turnaround is tight and service runs late, your durations are too short — guests stay longer than you have booked for. Lengthening them lowers your occupancy figure and makes your day work.
- Re-pace your intervals. High occupancy in a narrow window with capacity utilisation lagging means too many bookings land at once.
- Reshape or retire a table. A table at the bottom of the ranking for several months should be moved, split, combined or removed.
- Fix the seat gap. A persistent occupancy-versus-capacity gap is a floor plan problem, and the cheapest capacity increase available to you.
- Chase the Unassigned slice down. Assigning tables makes every other number on this page true.
Good to know
Merged bookings count on every table they use. A party across three tables occupies all three for its full duration — correct, and it means a night of merges legitimately shows high occupancy.
Unassigned bookings occupy nothing. They are excluded from occupancy and capacity entirely, so a day with many of them under-reports how busy you were.
Inactive tables are ignored — they are not in the denominator, so deactivating a table you no longer use does not drag your percentages down.
A 24-hour day counts as 24 hours. If you have a day set to 24 hours, expect a low percentage for it.