Reservation report
What this covers
Your booking volume and how reliably guests turn up — and the decisions worth taking from it.
Requires the view-reports permission and the Advanced analytics &
reports feature.
It is the first tab under Reports, and the one to open first.
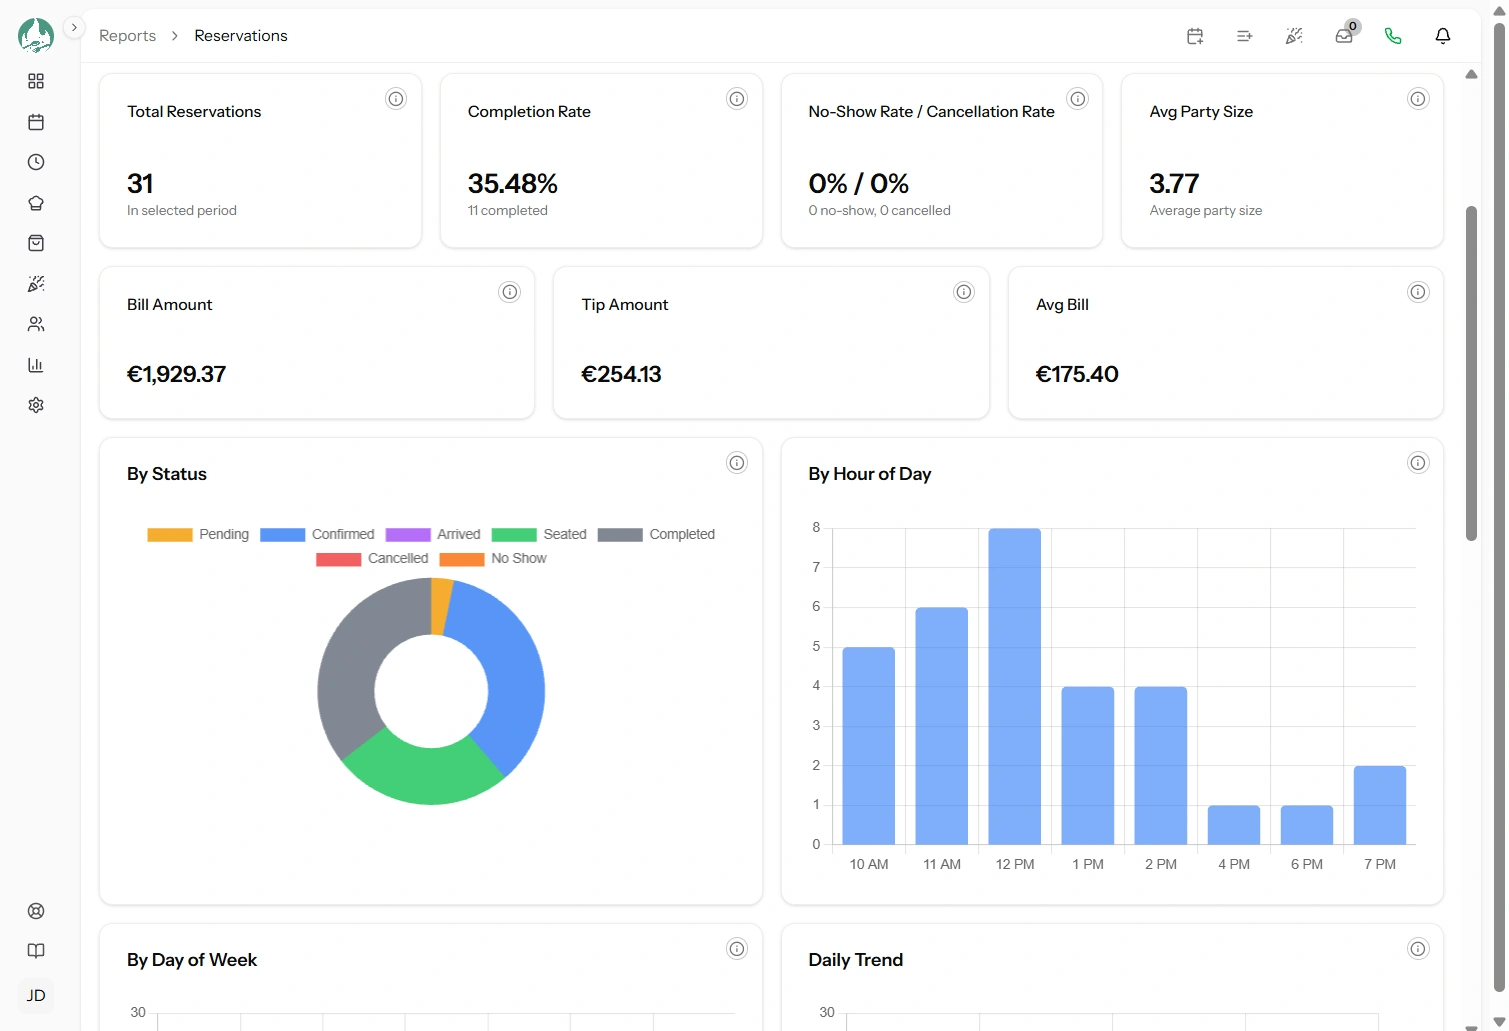
The numbers at the top
| Card | How it is worked out |
|---|---|
| Total Reservations | Every booking whose date falls in your range, in any status |
| Completion Rate | Completed bookings ÷ total bookings |
| No-Show Rate | No-shows ÷ total bookings |
| Cancellation Rate | Cancellations ÷ total bookings |
| Avg Party Size | Average pax across every booking in range |
| Avg Bill | Average of the bills that have actually been recorded |
All three rates share the same denominator — every booking in the range — so they do not add up to 100%. Pending, confirmed, arrived and seated bookings make up the remainder.
That is also why a range ending in the future wrecks these rates: future bookings are counted in the denominator but cannot yet be completed. Keep the end date at today or earlier (link Reports overview).
The charts
By status
A breakdown across all seven statuses. Use it as a data-quality check as much as a metric: a big confirmed bar for a range entirely in the past means bookings were never advanced to completed, and every other figure on the page is understating you.
By hour of day
When your bookings actually start. The most directly useful chart in the report, because it is a staffing rota argument settled by evidence: if 60% of your covers start between 19:00 and 20:00, that is where your floor staff need to be.
It also shows the shape of your service — one sharp spike means everybody arrives at once and your kitchen is under pressure in a narrow window; two humps mean an early and a late sitting, whether or not you designed it that way.
By day of week
Bookings by weekday across the whole range. Choose a range of several weeks or the numbers are just noise. This is where you find the night worth promoting — a Tuesday at a third of your Thursday is a room you are already paying for.
Daily trend
One point per day. Good for spotting the effect of something you did — a promotion, a review, a holiday — and for seeing whether a quiet patch is a trend or a bad week.
Top tables
Your five most-booked tables by number of bookings. Popular tables are usually the well-placed ones. Read it alongside the Utilisation report, which measures time occupied rather than bookings counted — a two-seater turning four times a night outranks a large table booked twice, without being the more valuable table.
Seatings breakdown
If you run fixed seatings, you also get a row per seating showing its bookings, covers, completed count and no-shows. This is the honest scorecard for a seating: an early sitting with a high no-show rate is a sitting guests agree to and then skip, which is worth knowing before you add another.
Bookings are matched to a seating by its start time, which is how bookings are created on a seatings day. A booking that was manually moved to a different time within the window will not be counted in that row (link Slots and seatings).
Decisions to take from this report
Staffing by hour
Read the hourly chart across a month and roster to the shape, not to an even spread. Then check it again each season — arrival patterns move.
Attacking the no-show rate
Note the figure, then turn on SMS reminders and compare a month later (link Reservation reminders).
Expect the win to appear in an unexpected place: a good reminder often moves bookings from no-show into cancelled rather than into completed. That looks like more cancellations and is unambiguously better, because a cancellation you hear about is a table you can resell.
For context, a no-show rate in the low single digits is healthy; anything sustained above roughly 10% is worth acting on.
Finding the night to promote
Take your weakest weekday from the weekday chart and read its hourly shape. A quiet night that is quiet all evening needs demand; a quiet night with one busy hour needs spreading, which is a pacing change rather than a marketing one.
Checking a cancellation rate that climbs
A rising cancellation rate with steady bookings usually means you are getting speculative bookings — often from the public page. Worth reading next to the booking page funnel.
Exporting
Export CSV gives you every booking behind the report, one row each, for the range on screen — the way to answer a question the charts do not (link Exporting report data).
Good to know
Walk-ins are included. They are bookings like any other, so they count in volume, covers and rates.
Unassigned bookings count here but not in Top tables, which needs a table to attribute to (link Unassigned reservations).
Avg Bill is not your revenue figure. For money, use the Revenue report, which counts completed bookings only.